Introduction
Since the Great Recession of 2008, Americans have been understandably skittish about housing prices. While the numbers may seem to show a strong recovery, deeper analysis reveals some alarming trends. Read this extensive article and see what we think about the 2017 housing market.
Step by step
This post originally appeared on the personal website of Ira Nicodemus, Founder and CEO of Propsee.com, and is reprinted with permission.
Executive Summary
Housing prices are not only inflated, but supported by a weak consumer base that is borrowing more than they can afford. Demographics are a ticking time bomb with baby boomers aging out of the workforce and millennials in dismal shape. Consumer debt exceeds pre-2008 levels and the default rates are increasing on the two highest growth sectors (auto and student loans). The "recovery" is a house of cards and a correction is overdue.
Wise consumers will prepare now by reducing debt loads and diversifying incomes and investments as much as possible to weather the storm.
Introduction
Our last financial crisis in 2008 had its roots in a massively overvalued and poorly underwritten housing market. Housing values in 2006 hit a peak of $23.9 trillion, which was accompanied by mortgage debt of $10.3 trillion, yielding equity of just under $14 trillion. Surprisingly, 2017 looks very similar with total housing value exceeding 2006 levels at $24.3T, debt holding steady around $10.3T, and equity rising to just over $14T with the positive difference. (Source: Urban.com)
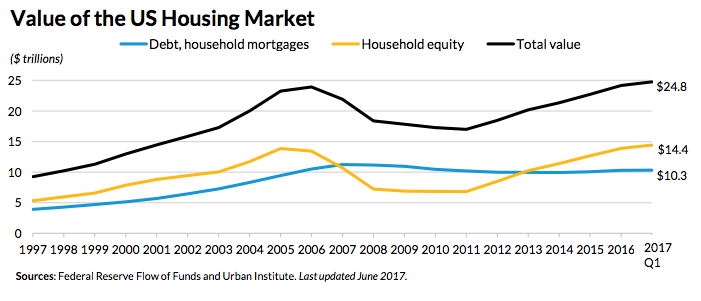
While this data alone seems eerily similar to pre-2008 levels, it is often dismissed as signs of a healthy recovery. It is not till other factors are considered that the gravity of the situation is fully realized. Let's discuss some of these here:
What is driving home values?
Housing has long been seen as a fundamental growth engine of the economy. In efforts to spur recovery following the 2008 crash, the Federal Reserve lowered interest rates to record levels. Below is a graph that shows rates over the past 10 years (Source: Trading Economics)
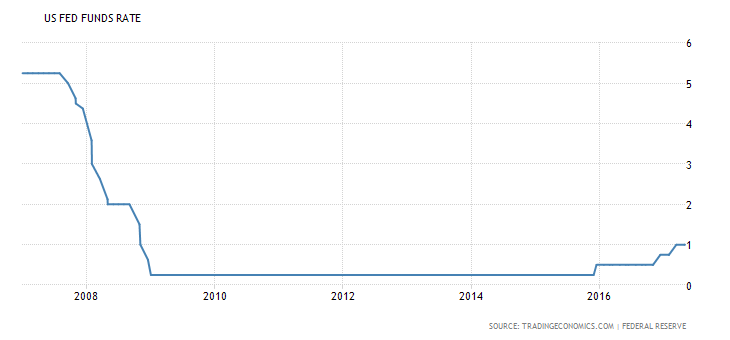
Low interest rates have encouraged people to buy homes, which is why we saw the bottom of housing values around 2011-2012 with a phenomenal recovery since then (see first graph). In addition, they have increased home prices substantially.
There are four main factors on the market side and three main factors on in the buyers side that go in to the value of a home in a given market. These are based on the assumption that people buy homes based on the monthly payment they can "afford" (read, "be approved for"). Let's start with the market factors.
Market Factors
- Taxes
- Insurance
- Interest
- Home Value
Taxes
Depending on the state, municipality, etc., taxes will represent a varying level of burden on the homeowners monthly payment. Areas with high property tax rates, such as NY state, traditionally see less volatility in home prices as this proportion of monthly payment acts as a buffer against the other three factors' impact. Areas with low taxes tend to see more impact on home value, but we're jumping ahead.
Insurance
This remains fairly steady but does have an impact to a lesser degree. If an area has low insurance premiums, less of the payment is based on this "fixed" factor, leading to more impact when the other factors change.
Interest
This is a big one. When interest rates are low, the buyer can afford more home for the same monthly payment. This is perhaps the biggest single driver in starting the run in housing prices seen from 2011-2017. (Note I said starting, because eventually other factors, such as speculation, take over).
Home Value
The output of the other three factors is home value. When you consider the equation, if taxes and insurance are low, then interest rates drop, the home value will increase to accommodate the same monthly payment from a buyer.
Buyer Factors
The above factors are predicated on a buyer with a certain amount of money to spend each month on housing. Unfortunately this is based less on good personal budgeting and more on what banks will approve. The factors here are pretty simple, as it is based primarily on debt to income ratio and lending viability.
- Income
- Debt
- Lending Viability
Income
How much a household makes is fundamental to everything else. So what has happened to incomes since 2008?
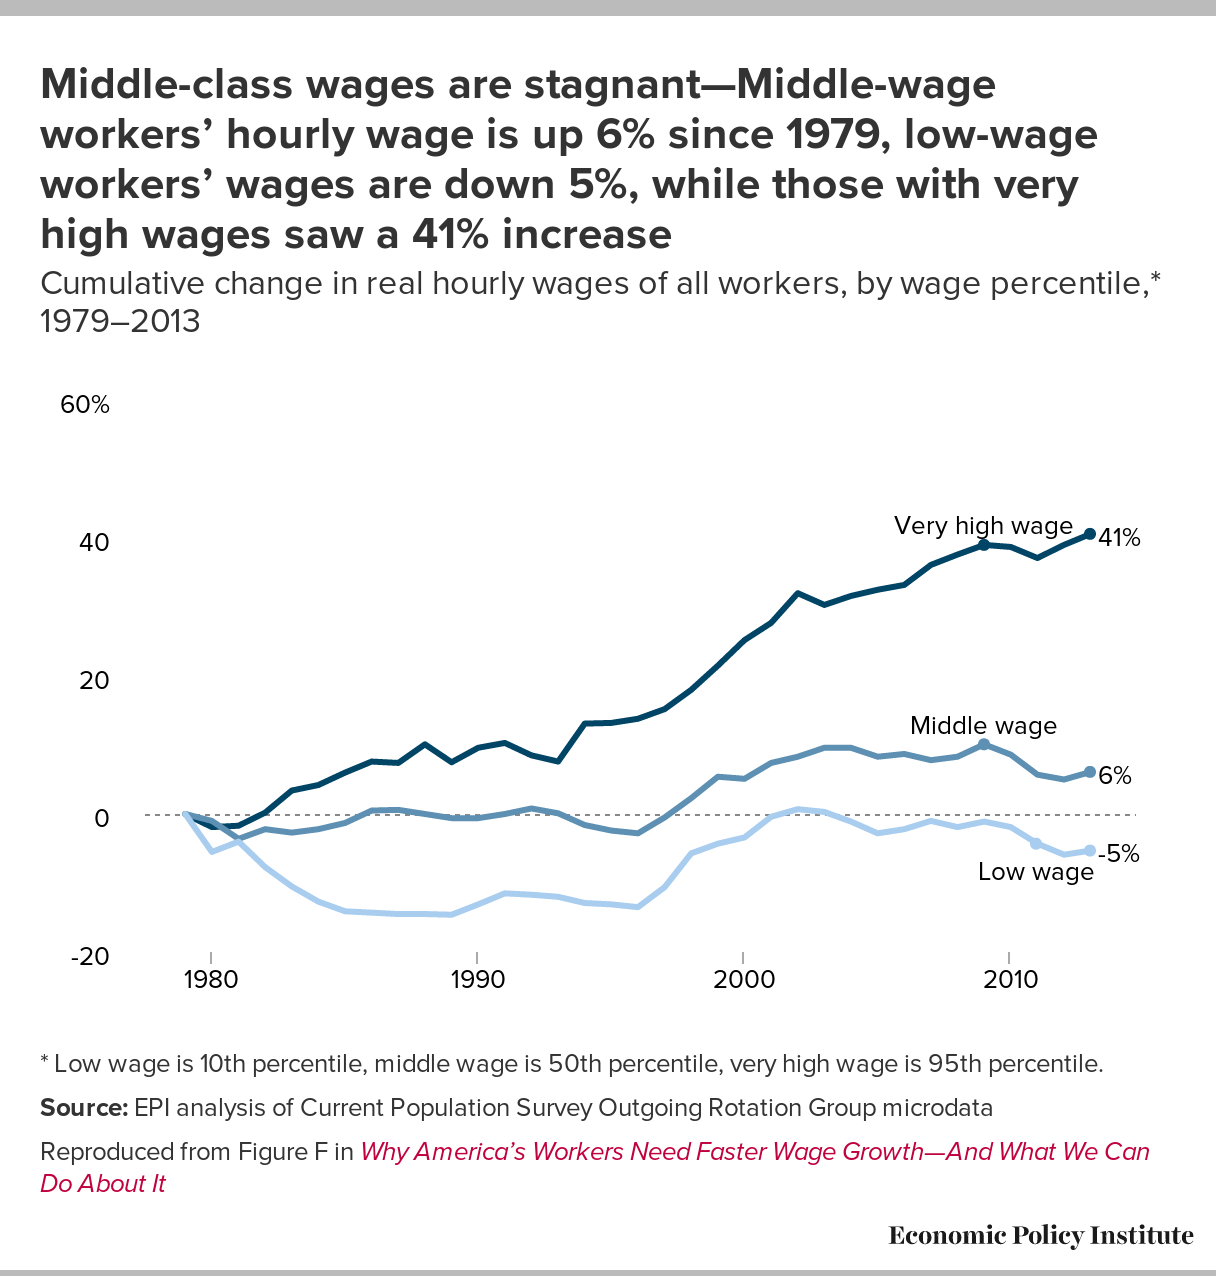
Much of the growth in incomes has been unevenly distributed among classes. This is not an article on the value or injustice of income inequality, but the reality remains that actual wage growth of the middle and lower class has been stagnant over time.
Debt
Banks loan based on debt to income ratios. We'll talk about how lending practices can influence this in a moment, but for now suffice to say that income alone isn't a great indicator of lending viability but rather income after paying other consumer debts.
We started by referencing the mortgage debt and showed that it is essentially at the same level as pre-2008. What this doesn't take in to account is the rise of other consumer debt, specifically auto debt and student loan debt. Viewed holistically, you see that the American economy is under as much debt load as pre-2008 levels, just in different areas. (Source: MarketWatch)

Household debt has surpass pre-2008 levels, and consumers are defaulting more and more on the two areas that have seen the biggest increase of debt growth, student and auto loans.
Student Loan Defaults
The WSJ recently reported that student loan repayment rates are far worse than recently reported, with half of students either defaulting or not paying a single dollar toward their loan balances 7 years following graduation. This is bad, really bad. Student loan debt far surpasses credit card debt at $1.4T and the default rates are about to go through the roof.
The growth in student loan debt is especially disturbing, given how it impacts that portion of a vital demographic, as we'll discuss soon.
Auto Loans
The auto industry has been doing great since 2008. As with everything, what is driving that? Debt. Lots of it. Auto loans are much higher than 2008 and default rates are on the rise. 17% of borrowers are likely to default in the next year. This is on another ~$1T in outstanding debt. (Source: 247wallst). The worst portion of this is sub-prime auto lending, which is nearing 20% of total lending and experiencing default rates over 5%,
Lending Viability
All of the above items are great, but the other big factor is what the banks will (or are allowed to) lend. Credit scores are a big factor here as well as debt to income ratios. Government programs and how these factors are calculated also play in to the mix.
In 2015, Fannie Mae rebooted the HomePath program (Source: Fox Business), which not only allows buyers to purchase a home with little documentation and only 3% down, but allows multiple income sources to be counted on the application (aka. multiple family members). This was an effort by the Obama administration to help recent immigrants buy homes. What this has done is increase values of entry level homes to unsustainable levels for the actual population buying them, and little data is known on the actual viability of these borrowers.
Debt to income ratios are also being relaxed in several areas in the past few years. A key one to watch is around student loan treatment. Fannie Mae is now allowing people who are in adjusted repayment programs count the lowered payment toward their debt ratio without consideration to the total outstanding balance. In addition, they are encouraging people to refinance to pay off student loans, which will only shift debt from student loans to housing. Lastly, people that have parents helping them on debt or repayment do not have to count that toward their qualifications. (Source: Chicago Tribune).
So in an effort to spur growth in the entry level and middle class segments of the population, we are just taking new tactics to bring in unqualified borrowers, which is inflating prices and encouraging poor financial stewardship.
Has there been a real recovery?
"But what about unemployment?!", you say. "Haven't we seen job growth?". Yes and no. The reason that the federal reserve had a slight interest rate hike this Spring and is expected to increase rates again in June 2017 is based on this metric. Here's a chart to give basis to their thinking:
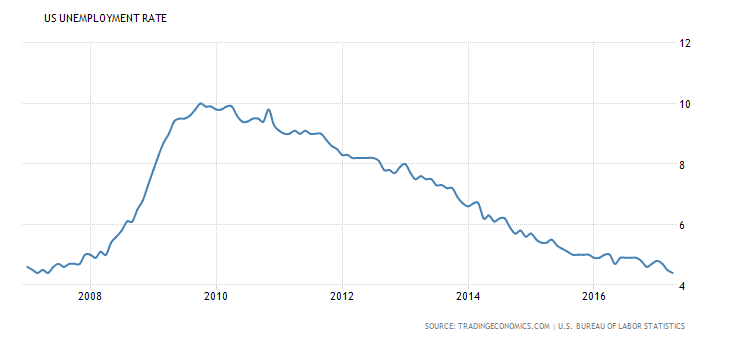
What this doesn't take in to account is the labor force participation and employment rates.
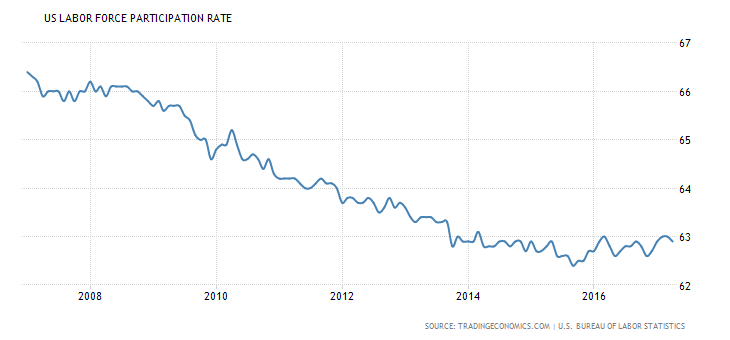
You can see here that while unemployment has decreased, so has the overall % of people in the workforce. What is happening to all of those who are no longer seeking employment and how do they impact the unemployment values?
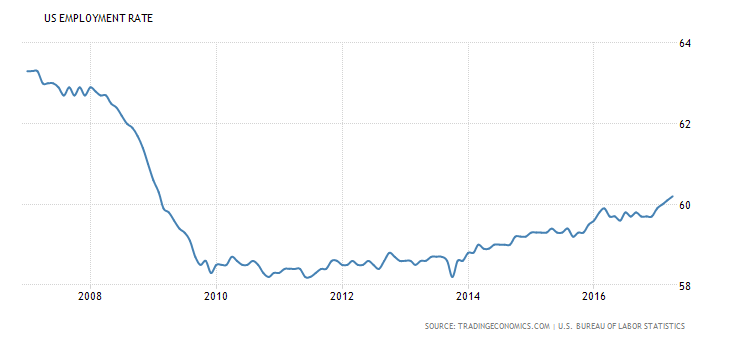
Another way to look at this is the overall employment rate, which has not recovered to pre-2008 levels even as unemployment has dropped.
Demographics
The population is aging. Baby boomers are aging out of the workforce in record numbers. Rather than being replaced with a strong generation of workers, we are seeing a very weak segment of millennials struggling to get a start on life as they are crippled with student loan debt.
Based on the most recent census data, over a third of people from ages 18-34 are living at home with their parents. This is up from 25% in 2005. In addition, real wages have dropped for men in this demographic since the 1970's. (Source: The Hill). To make matters worse, about a third of those living at home aren't even working or in school.
While more people have college educations, the value of these degrees is dropping. Here's a chart that shows earning for recent college graduates (Source: EPI):
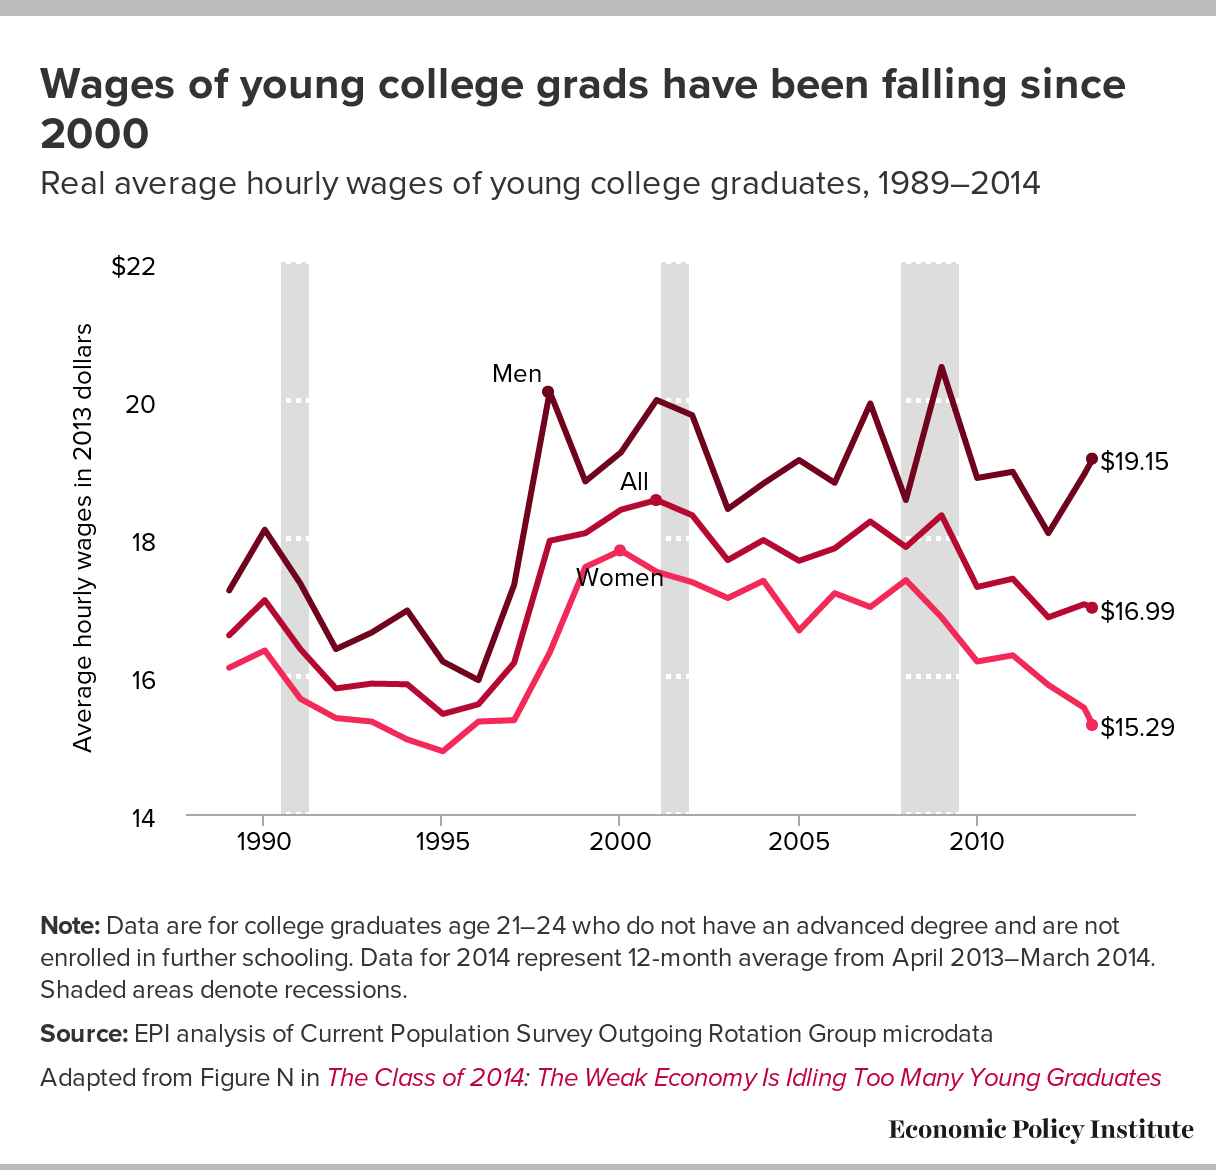
An entire generation that should be coming in to the workforce, buying homes, starting families, etc. are living at home, burdened with debt, struggling to find jobs, taking bad jobs when they can find them, buying homes they can't afford, and being subsidized by their parents in countless ways.
Speculation
All of this artificial demand and price increases have led to speculators seizing the opportunity and artificially driving prices even higher. When people buy at high prices with anticipation to sell to someone else at even higher prices, prices are no longer an indicator of actual value. This is why average home price to income (PTI) ratios has increased to record levels in many markets. A "normal" national PTI is expected to be 3.5, which means the average house cost 3.5 the average income. In 2005-2006, national PTI was up around 4.7, just before the bubble burst. Where are we headed now? North of 4, which is dangerous territory. (Source: Freddie Mac).

When values get too out of line with incomes, it is usually driven by speculation (investors aren't real buyers), dangerous lending practices (see above), or a combination of both. In the current case, it is likely the latter.
Another metric that is interesting to watch as an indicator of investor activity is the % of homes being flipped. In 2006 it had risen to 7.3%. Now it is over 6% and climbing. (Source: ZeroHedge)
"A rising tide carries all boats" is an appropriate axiom here, as everyone is making money on flips. Heck, by the time a property undergoes a 3mo flip, it has probably already appreciated 5% these days! People are paying not only over asking, but over appraisal as there's a mad scurry to pick up houses and make a quick buck.
So what's going to happen?
Another tide saying that bears repeating is "When the tide goes out, you can tell who's skinny dipping" (Warren Buffett). Based on all of the evidence above, there is a very good chance that the tide is soon going to go out, and unfortunately there's a lot of people skinny dipping. So what's going to trigger a correction?
Rising Interest Rates
We've already talked about how the Fed's low interest rates have been a primary driver in growth. So what happens when those rates go up? Since incomes are already strained with high PTI ratios and consumer debt, there is no room for monthly payments to increase to accommodate a higher interest portion. This means that home values will need to come down for a real buyer to afford a purchase. While this won't impact current home owners who have fixed rate mortgages (thankfully ARMs are not as prevalent as they were in pre-2008), it will cool the market. This cooling will start to slow investor activity as well as demand slows down. If all goes well, then we will simply see a reduction to normal appreciation from the 10-20% annual increases we've been seeing. This is the plan and why the Fed has been so slow to raise rates.
Of course, it is possible that a big rate increase is enough to send housing prices in to negative territory. This alone likely won't be enough to cause a 2008 level event, but it will be rough for people who purchased with low equity.
Other Consumer Debt Defaults
As referenced earlier, people are already starting to default on some types of consumer debt, such as student and auto loans. Even though these segments have grown to $2.4T total, they are still not big enough to singlehandedly cause a 2008 level event, when over $10T in mortgage debt was suddenly exposed by a 25% drop in housing values. If consumer debt is to be the culprit, it is because it triggers a series of events and defaults in the mortgage debt.
The demographic issue comes in to play here, as a big question remains of how the Baby Boomer and Millennial generations will interact. Since so many millennials are subsidized by baby boomers, there fates are likely inextricably linked. If a baby boomer wants to sell their home, but there is no millennial to buy it, how will that impact housing prices? If that baby boomer can't cash our or downsize, how will they retire? What happens to the millennial at home when the baby boomer does retire, if they are able? What happens if the millennial tanks the economy with their student loan debt and now the baby boomer can't retire?!?
A combination of many factors
Almost 10 years later, there is still much debate of what led to the crash in 2008. Housing was definitely the large part of it, but these things are complicated and it is rarely one factor. Usually it is a combination of poor practices and then someone gets spooked, causing a panicked selloff.
So what should you do?
"So if you're right, what do I do?!". Don't get scared, just get prepared. Pray about some of these things.
Get Rock Solid
Cut or avoid debt as much as possible. Start with simple consumer debt like credit cards, student loans, or auto loans. Do everything you can to drop these or avoid them. Sell the BMW, go to community college, or take a part time job. Get rock solid so you can survive the storm.
Evaluate Your Housing
Are you renting? Consider staying that way. It may seem scary watching prices go up and wondering if you will ever be able to afford a home, but even if I'm wrong about a major price correction (5-20%), it is very unlikely that you're going to see 10-20% appreciation in 2018 and 2019. Don't make the mistake of jumping in at the top of the market with a low down payment out of FOMO.
Do you own? Consider selling. This isn't for everyone, but if you are in a position where you can downsize for a while, either to rent or buy a lower price home, consider doing so. This may not be for everyone depending on your family situation.
If you already have substantial equity in your home, you're probably ok to stay. It might suck if prices go down and you missed the timing, but at least you aren't going to get foreclosed on if you already have 30-50% equity in your home at current values. Just stay where you're at and focus on paying off any consumer debt and/or building your savings.
Diversify
This is typically used when talking about investing, and that applies here as well, but also consider diversifying your income streams.
From an investment standpoint, there is no one right answer. Someone who is in their 20's could stay in a high stock's ratio and even if we do have another 2008 will have plenty of time to recover. However, I'd encourage even this person to consider shifting at least some of their assets to safer investments to counter or buffer a stock market correction.
Income diversification is more here and now than your investment portfolio. If you are like most people and get all of your income from 1-2 sources, consider adding a little to that. Can you pick up freelance work or start a side business? Even if you don't get to where this is a major contribution right now, at least it is available so that if you lose your primary income you have something else you can ramp up to replace it.
Summary
My intent with writing this was not to instill fear in anyone. I could be wrong about all of this, as there are people smarter then me that could easily dispute all of my points and data. However, from my view as a Stewardship junkie, I feel strongly that we are not able to survive as a nation addicted to debt forever. It is like someone who lost their job but just kept living it up on credit cards for a few years...eventually the party has to stop. I simply advise you to prayerfully consider what I've said and perhaps take some steps to prepare for the possibility that I'm right.
Blessings,
Ira


